Virtually all companies collect worksite safety observations. Sadly, most companies collect only unsafe findings. This results in a very incomplete picture, as discussed in “The Value of Safety Observations, Especially Safe Observations”. Those companies that do collect safe observations use a standard metric called Percent Safe (% safe). This metric is a simple calculation that factors in the number of safe observations and the number of unsafe observations, providing a percentage.
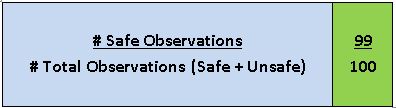
For example, if 100 observations were collected and one of them was unsafe, this would yield a percent safe result of 99%, as shown in the example above.
Unfortunately, many companies view this is as a measure of risk. For example, if a company received a safety report and it showed they were 97% safe, they would think that was great! The truth is that it’s likely not. Let me provide you with some things to consider:
Consideration 1:
There are two observed entities (e.g. contractor, crew, department, project) that have a % safe score of 97% and 85%. Based on this metric, which one is safer? Well, we all went to school and a ‘97’ is an ‘A+’ so we would think this is better. However, let’s peel back the layers and see what drove the result. Entity 1, at 97%, could have several high severity findings (e.g. Fall Protection hazards identified). Entity 2, at 85%, could have several low severity findings (e.g. Minor administrative or P.P.E. issues identified). Although the 85% result appears significantly worse at face value, the 97% safe result could actually be more “at risk”.
Consideration 2:
Percent Safe is often a combination of different categorical findings. For example, it could include P.P.E., Housekeeping, Fall Protection, Administration, Electrical, etc. On average, we typically see approximately five categories included in each single inspection report. Using the examples above, it could look like this:
- The 97% finding could be three Fall Protection findings – all unsafe – and 97 P.P.E. findings – all safe.
- The 85% finding could be P.P.E, minor administrative issues, and minor housekeeping items with a few unsafe with low severity potential in P.P.E.
On the surface, a high percent safe result provides comfort but doesn’t provide a clear indication of risk. Conversely, a low percent safe result could give the appearance of high risk or a raise alarms but likely be relatively low risk overall.
Many companies take tremendous stock in these results. I call this phenomenon “Appearance-Based Safety” which is essentially a metric that provides a warm and fuzzy feeling indicating all is well but masks the risk and stifles important opportunities to improve. This fosters some of the most dangerous safety related situations.
Alternatively, if used appropriately, the percent safe metric can provide some key benefits. The first is long term trending at the categorical level. We must remember that an inspection is a snapshot in time. When a statistically significant number of observations are collected with the same or similar theme (e.g. Fall Protection category) percent safe can provide a good metric on the efficacy of the safety process.
The percent safe metric can also be used to measure systemic progress. When a process is deemed ‘out of control’ or in need of improvement, then percent safe is a good metric to determine if positive strides are being made. More safes should be seen and fewer unsafe observations should be discovered if action is taken to apply controls to the process. The key again is that the data must be closely grouped within a common theme and evaluated for value.
In conclusion, when looking at the big picture it becomes clear that percent safe in and of itself is a poor risk indicator, especially at the single inspection level due to the small sample size (see Consideration 2). It’s also very easy to overreact to the number and make harsh statements or decisions which can be damaging to any progress you’ve made. Percent safe does what it is designed to do – provide a ratio of safe vs. unsafe findings collected and documented. It is the understanding of the metric, as well as its limitations, along with the positive actions taken with the findings that makes it effective.


