We’ve all seen and read the articles about how data can help us improve production, quality, safety and environmental performance within the work environment. With that said, how many of us have actually been close to a real life scenario where an incident happened and data was available, but wasn’t used? For me, this story is unsettling and my fear is that it’s happening more often than we think. My hope is that this article brings to light the value of using your data preventatively, in order to identify common risks which may be present every day.
From time to time, the Process and Technology Team at Predictive Solutions makes random contacts to our client base to discuss the status of their data and determine how they are tracking against their goals. From an agenda perspective, this is a discussion which is focused on feedback and a review of the most common reports in the system.
This is a no frills, real life case where the data could have been used to prevent a serious injury. Let’s review it and discover how we might avoid taking the same path.
Overview
This session began with a standard review of the overall process and a discussion about how the team was progressing to plan. The feedback was good, although mention was made of an incident which occurred to a subcontractor who fell nine (9) feet. During the fall, the worker sustained a head injury along with a fractured wrist. When I hear something like this, I start to think about the data and what might have led us down a path to identify the leading indicators which, if recognized, might have helped to prevent this. It’s important to note that this was a situation where they were not reviewing the data. In talking with the client I asked what they believed led to this and they thought it was a planning issue. This as a key point as it will come up again within the context of this article. Where would you start if you were looking for the key leading indicators?
The Data
The focus of this review was on 90 days prior to the date of the incident and the first report we reviewed was the Summary Report. The Summary Report shows categorical information and exactly what was (and was not) observed over a period of time. A sample Summary Report is shown below.
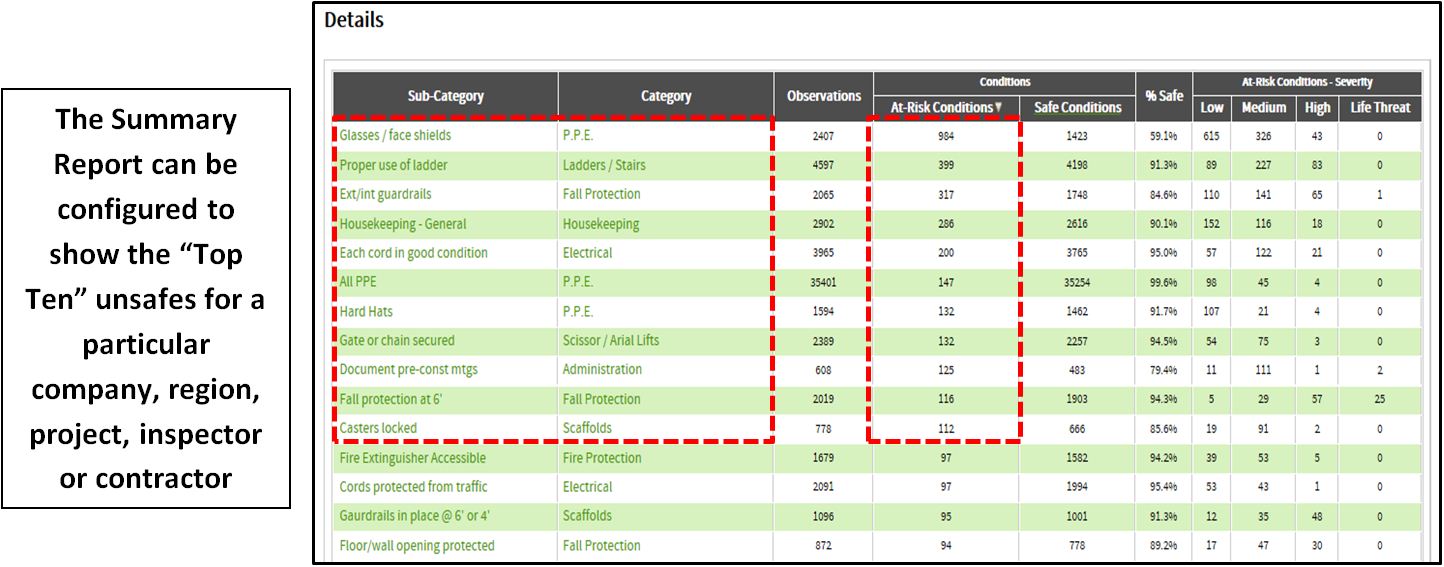
Upon review, there were 34 at-risks which had been identified in the category of fall protection and 32 in the category of PPE. Sometimes we see an uptick in the at-risks collected for PPE and believe that it’s related to an attempt to collect low hanging fruit and while in many cases it is, you will see that this case was different.
The next report we reviewed was the Detail Report which shows virtually all aspects of the observation and provides the most information available. We saw that the non-mandatory field known as “root cause” which is available for selection at the observation level wasn’t always filled out, but for the ones that were, over 30% were chosen as “Not Following Plan.”
The third report we used to look into this further is the Summary Drill Down. This is a function within the standard Summary Report which allows the user to look at categorical, project and contractor information along with specific details. What we found was that when viewing by project, the one with the highest number of unsafes for fall protection by a factor of almost three, was the same project where this fall incident occurred.
Additional Incident Findings
While our investigation of the data occurred only over the course of an hour, there was a much larger investigation that occurred within the organization. It was identified that the injured party wasn’t trained or qualified to perform the task. The fall protection that they were wearing was rigged from the floor level, as opposed to above the employee and the harness which was worn, had no leg straps. While the Foremen were trained, they didn’t understand the basic principles of use and essentially provided the PPE without knowledge or documentation of the employee’s competency.
This subcontractor was used without supervision or regard to a policy which mandates that the safety department be notified prior to them working on the project. It was also reported that the project where this incident occurred was responsible for 50% of the incidents since the beginning of the year.
Lessons Learned
The data told us that the observers believed that PPE was a primary issue. In many cases, elevated PPE counts occur in the absence of a well understood inspection strategy. These are often simply cultural proxies for a larger issue. In these types of cases, we should not only look at the data collected, but discuss it with the teams as well. This type of communication encourages thinking about what was identified, as well as other relevant items based on the ongoing tasks. Since there were a substantial number of fall protection concerns, these provide considerable opportunity and priority for prevention.
When asked, the client believed that a lack of adequate planning contributed to the outcome of this incident. The data told us that the observers, while performing their observations of at-risk conditions, believed the same. A third of the root causes assigned were chosen as “Not Following Plan.” The lesson learned here is that we should be listening to what our observers are saying as they are the eyes on the front line.
The highest numbers of unsafes were found at the location where the incident occurred. When we look at the data and see an at-risk trend, that’s the time to take action and investigate what the circumstances are which are driving the number up. Consider this as a pre-incident investigation that can lead to the prevention of a potential injury.
Summary
When you think about the mechanism of injury and then compare to what the data was indicating prior to the incident, the benefits are clear. Taking it one step further, combining the current data along with the historical incident data is a great way to refocus your inspection strategy to ensure that the things that matter the most are being looked at.
You’ve taken the time to train your employees on your observation process and are working towards improving all phases of the continuous improvement loop. This is a critical advance towards long term sustainability. The next logical step is to then coordinate action on information that is likely already there for your use.
Finally, we do what we do because we’re trying to support the continuous improvement process and reduce the injuries that are occurring on our work sites. Part of this is building the culture through employee involvement. When your observers are conducting observations, that’s participation! There is no better way to say thank you than taking the time to review their data and improving the process based on what they identified in the field.


