In the first article of this series, “Reflections on Safety Barriers”, we discussed some general principles of safety barriers and proposed a wide operational definition. The second article, “Assessment of Safety Barriers”, described one possible way of doing a hazard and safety barrier assessment, including a practical example. In the third and, for now, final part of this series, we’d like to discuss some possibilities of how to strengthen the management of safety barriers in an organization.
Knowing and understanding barriers
Safety management is often approached from a somewhat negative perspective. One of the essential elements of good safety culture and good safety management is knowing your challenges, usually based on risk assessments, incident reports and the like. Nothing wrong with that, but it’s also important to know your strengths, and the barriers you have put in place may just be that.
Norwegian railway safety regulations stress that “Barriers shall be identified, and it shall be known in the organization what barriers have been established and what function these have” (Sikkerhetsstyringsforskriften § 2-3). While this requirement may be rather idealistic and hard to fully comply with to the letter, we do agree with the bottom line. Understanding of barriers in all their variations; be it Man, Technical or Organizational (MTO) is an essential factor. After all, how can you manage something you don’t know about? Awareness of some of the misunderstandings discussed in the first article may be an important factor.
Incident investigation
Probably the most basic feedback tool on barriers is incident investigation. Having models like the Swiss Cheese Model in the back of our mind, one may, after all, reason that if an incident has happened, then one or more barriers appear to have failed.
Jernbaneverket has chosen PRISMA [1] as its taxonomy for root causes. This taxonomy is structured after the MTO-principle and if the investigation is of a good enough quality, it’s often easy to relate identified underlying or root causes to barriers that have failed in one way or another. Let’s look at a hypothetical, yet life-like, example.
Rail traffic safety depends a great deal on the signaling system. Missing a ‘red light’ can mean a critical mistake and bring a train in the path of another train, annihilating the carefully planned separation in time and space. This is a reason that much of the rail infrastructure is protected against this type of event, attempting to stop a train as quickly as possible after passing the signal. A SPAD (Signal Passed At Danger) is probably the most important kind of precursor incident to a collision between trains [2] and will generally be carefully investigated.
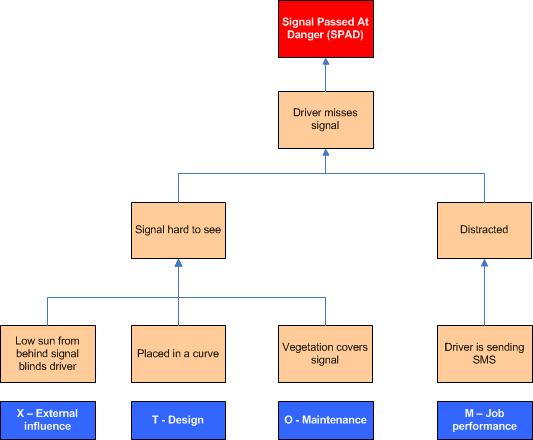
The diagram below shows a causal tree of a fictional case where a driver misses the signal because of two direct causes: he was distracted and the signal was hard to see. Working down towards root causes (very simplified) we find that the driver was texting while driving (a conscious violation of a known rule) and that the signal was hard to see because of three underlying factors: there was vegetation that covered part of the signal due to neglected maintenance, the signal was placed in a curve, and at the moment of the incident the driver was blinded by a low standing sun. The blue boxes below the causal tree indicate the PRISMA categories. Relating these to barriers we see weaknesses in Design, Maintenance and the performance of the job. We even can consider altering the standard design of the signal (e.g. by attaching a larger back screen) such that sunlight isn’t so big a factor anymore.
And of course we don’t need to limit ourselves to information from one incident. By looking at trends in your safety statistics you may find out that some locations are more vulnerable than others, or that a particular (root) cause occurs frequently indicating a weak spot, e.g. in the management system.
Find the weak spots in your barriers actively
Systematic and proactive safety management means that we’re not waiting for incidents to happen before we take action. One way of knowing the weak spots in barriers is obviously through analysis and assessment as discussed in the second part of our article. But there are many other methods.
Leading indicators such as audit, inspection and observation programs, maintenance records, competence management and training and many others provide useful information. Matching the HSEQ-database and other databases to barrier assessment/identification may be a goldmine of information.
One may even consider dedicated monitoring of certain critical barriers. An example is presented below. Starting in 2012, Jernbaneverket monitors a special routine where trains are allowed to pass a signal that is temporarily out of order. This means that technical barriers are temporarily disabled and that safety mainly depends on good communication routines. By monitoring these cases it’s easy to identify weak links in the infrastructure where failures are more frequent [3], and start actions to improve the situation. As an example, one could name the second and third highest locations. These two locations are related and the diagram clearly shows that most events occurred in the same period, January 2012. A bottleneck in supply of spare parts and shortcomings in the routine to handle the damage were revealed. Both were remedied.
Gathering this data for the first time also made it possible to correlate the data to available information in the maintenance database and information about the (less frequent) occurrence of SPADs. There turned out to be a significant correlation for a number of locations, so this new monitoring enhances the possibility for risk management.
Recovery factors
Traditional incident investigation tends to look at what went wrong. A rather unknown, and little used, ‘enhancement’ of investigations is to look at what went well. This can in many cases give you information about barriers that worked, in some cases you may even discover barriers that you weren’t aware of before and which you can further improve on and can be strengthened.
The PRISMA taxonomy additionally provides a number of so-called recovery factors. A recovery factor is something that explains why an incident didn’t develop its full potential; why an incident didn’t lead to injury or greater damage. Recovery factors are the things that influence the course of an event positively and save the day, so to say. Recovery factors may be mechanisms put in place willingly to detect failure and counteract in a timely manner, but quite often recovery factors are not planned beforehand.
Looking at recovery factors means that one doesn’t just look at what has happened, but one takes into account what potential there was in an incident and why it didn’t get that far. Emergency response routines are a typical example. Evaluating those in relation to incident investigations often gives valuable information about possible improvement.
The PRISMA taxonomy (adopted for Rail) contains the following recovery factors:
| Technical - Planned | Employee - Planned |
| Technical - Not planned | Employee - Not planned |
| Organizatorial - Planned | Customer - Not planned [4] |
| Organizatorial - Not planned | Public - Not planned |
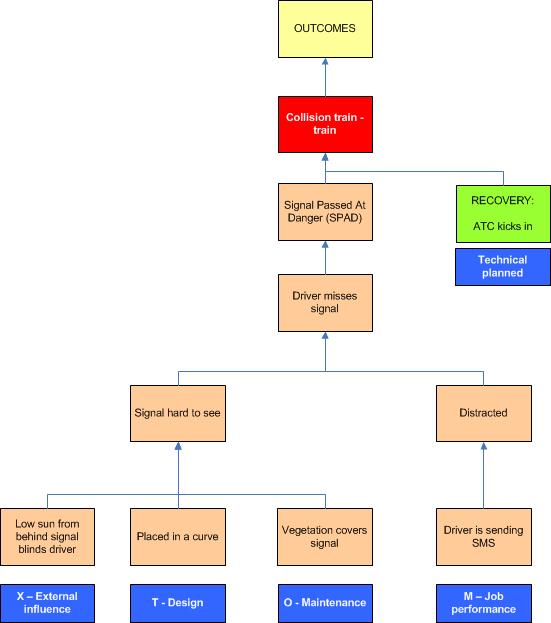
If we revisit our SPAD incident we can elaborate on the causal tree. The SPAD incident could have resulted in a collision between two trains with a number of possible outcomes (people dead or injured, material damage to rolling stock and infrastructure, delays) not specified in the diagram. This, however, didn’t happen because the automatic train control system (ATC) detected the passing of the signal at danger in time and stopped the train within the safe distance. This clearly was a recovery factor that was planned beforehand.
In 2004 Dutch railway infrastructure manager commissioned an analysis of 89 near-miss incidents with track workers (near collisions) reported in 2003. The aim of the analysis was to see if some common root causes could be found. One finding was that it was possible to clearly identify recovery factors in 45 of the cases. The two most important recovery factors were related to successful unplanned interventions by employees:
- Track workers noticed a nearing train and saved themselves or their colleague by pulling out of the tracks in time.
- Train drivers noticed the work crew and signaled by ‘honking’ which prompted the track workers to clear the track.
Identifying these mechanisms gave the possibility to strengthen them, e.g. as a part of training. Interestingly, the ‘honking’ action wasn’t described beforehand, neither in formal training, nor regulations; this was something that people ‘just did’.
In our experience many safety professionals do focus very much on things that went wrong. While there’s a lot to learn from things that went well, as illustrated by the examples above, looking at recovery factors (barriers that worked) is an element of incident investigation that is still rather unknown, even though it is facilitated by other methods besides PRISMA, and should be used more widely.
---+---
This concludes the final part of this three-part article on barriers. We realize that space limitations caused us to leave many important and interesting things unsaid. We hope to have given a few suggestions for reflection and possible improvement in organizations. Feedback and discussion is warmly welcomed by the authors.
[1] PRISMA stands for Prevention and Recovery Information System for Monitoring and Analysis. It was developed in the 1990s at the Technical University of Eindhoven, The Netherlands. The taxonomy is used in various industries, including chemical, oil and gas, railway and health care.
[2] See for more information the SPAD page at Wikipedia.
[3] The diagram shows the ‘Top 20’ in 2012, the numbers on the x-axis are coded location-ID’s.
[4] It’s hard to plan actions for customers and the public. This is a reason that PRISMA doesn’t contain ‘planned’ recovery factors for them. One might consider the successful evacuation of a plane after a safety drill onboard as one, even though one just as well may argue that this should be classified as a planned organizational measure. Taxonomy or not, this is no exact science, you know.
-------------------------------------------------------------------------------------------------------------------
Biography
Carsten Busch has studied Mechanical Engineering and after that Safety. He also spent some time at Law School. He has over 20 years of HSEQ experience from various railway and oil & gas related companies in The Netherlands, United Kingdom and Norway. These days he works as Section Head Safety and Quality for Jernbaneverket’s infrastructure division.
Beate Karlsen has studied Occupational Health and Safety at Haugesund and at the Stavanger University. She has been in various OHS functions in Jernbaneverket and works currently as Senior Advisor Safety in Jernbaneverket’s infrastructure division.


