Barrier assessment in practice - an example
In the first part if this trilogy, Reflections on Safety Barriers, we argued that focus on safety barriers is one way to deal with some of the shortcomings of traditional risk assessments. We further talked about general principles and posed a wide operational definition and discussed some misunderstandings. In this second part we’d like to take a look at a practical example and discuss a possible method.
Background
In June 2011 we had a fire at Hallingskeid[1] in an artificial snow protection tunnel up in the mountains leading to the loss of two train sets and causing severe damage to railway infrastructure (not to mention the delays). Following this incident we had to evaluate preventive actions we had considered in the past and for the future. What better way than barrier assessment to see what was in place, what could possibly put in place, and how good these barriers intended to control the fire hazards actually are?
No method was immediately available, but we had already been thinking about a barrier-based approach to assessments and been toying around with some ideas, so the project gave a positive boost to try out some ideas. The approach chosen was very much inspired by two wider known tools: fault tree analysis (FTA) and the BowTie XP tool.
We experimented briefly with a traditional FTA where we included barriers in the various branches. FTA is a very powerful tool, but we experienced difficulties to phrase events/failures and barriers in such a way that they made sense and weren’t expressed in ‘forced’ statements. One possibility is building all branches with a combination of hazards and barrier failures combined by an AND gate, but this makes for an awkward tree and neither did we like to see all our barriers phrased in negative statements.
Our tool of choice would have been BowTie XP because of its ease of use. One disadvantage of this piece of software, however, is the non-linearity of the branches in diagrams which makes them more difficult to understand. They are not really intuitive and require training and continued experience. An additional problem was that we had neither the budget for acquisition of the software, nor the time for the process with procurement and ICT that alas is mandatory in a public company.
Method for hazard and barrier assessment
Hazard and barrier assessment (HBA) was considered a good systematic tool to identify hazards and barriers and assess possible weaknesses in the system. The HBA we ‘developed’ had to be qualitative, easy to use, explain and understand (thus be visual) and be cheap (i.e. done within the possibilities of available generic software). We settled for kind of a hybrid of the FTA and BowTie methodologies which we refined as we went on.
The process for this HBA is as follows (numbers corresponded to the diagram below):
- Choose the unwanted event you want to assess, often some kind of incident/accident. Be specific about the situation, object or job in order to clarify your scope and to keep the assessment within workable limits (so choose “fire in the workshop” instead of “fire”).
- Identify possible consequences of the unwanted event.
- Identify possible barriers that prevent or mitigate these possible consequences of the unwanted event. These can be specific for one or more consequences, or common for all consequences.
- Identify possible initiating events or direct causes of the unwanted event. To do this it’s practical to go through all hazards/possible sources of energy as well as through the various sub-systems.
- Identify possible barriers that can stop these initiating events from growing into the unwanted event.
- Identify possible barriers that prevent the initiating event from occurring.
- Identify possible (underlying) causes that may cause the failure of the (in steps 3, 5 and 6) identified barriers. This may be several causes per barrier.
- Identify possible barriers against these causes for barrier failure.
- Repeat the previous steps as often as necessary/practical.
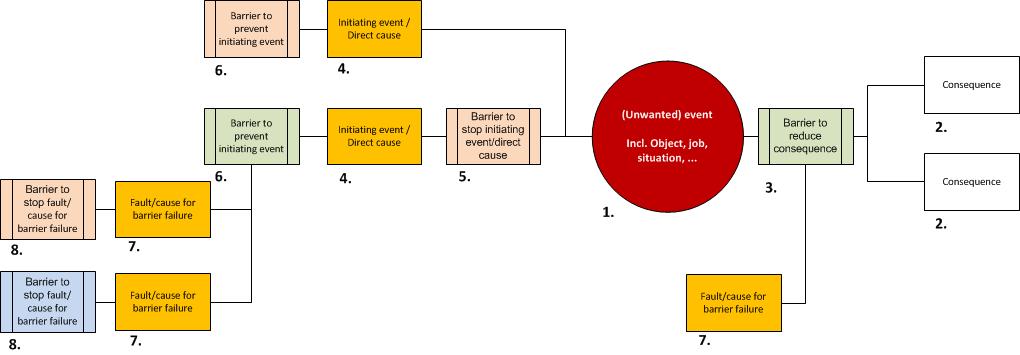
The identified elements are drawn in chronological order, such that a preventive barrier precedes an initiating event (unlike with BowTie XP). Causes for barrier failures are drawn on a ‘lower level’ than the barrier they affect in order to create a clearer view. The result will be something that strongly resembles a BowTie diagram. We decided to color code the various items such that it’s easy to separate events/causes and barriers and also distinguish between the various types of barriers (e.g. M, T and O). We used the Visio package, but other graphic packages should do nicely and a roll of brown paper with colored sticky posts will be perfect as well.
The various elements (failures, causes, events and barriers) identified in the assessment can be described in further detail in a table. These detailed descriptions discuss the factors that affect the quality of the barriers, the probability of initiating events and the party responsible for the barrier, among other things.
The model can be built into infinite detail, of course, because it will be often possible to elaborate with new barriers and new possibilities for failures. Further than a few levels, however, is hardly ever practicable because the diagram will become unreadable, or the additional information is not really worth the effort. As a general stop-rule one shouldn’t go further than elements that the organization can control, or influence. One possibility to handle a higher degree of detail is to include this into the descriptions/assessments of the various items in the table. In several cases we found it more practical to describe possible barrier failures as part of the assessment of the robustness of the barriers in the table, rather than drawing additional branches to the diagram.
One important difference with FTA is that we chose not to use OR and AND gates in the diagram. In principle the diagram shows possibilities without taking into account all dependencies between various branches or elements. This may cause some minor challenges in some cases as illustrated in the example below. These can for example be resolved by combining or splitting elements.
Essential in the process is the involvement of relevant competence. This is one way of minimizing and identifying uncertainties. The same can be said about systematic and structured critical checks to ensure as great as possible completeness (e.g. by going through all possible energy sources/hazards and barriers).
An example
An example is provided below. Since space is limited we’ll do a simple version of a comparable situation from the Hallingskeid fire assessment – applied to your garage at home. The example is heavily simplified and all of the elements could be seriously elaborated.
As the central element we chose the unwanted event of a fire in your garage which is located on a good distance from your home or other buildings. Consequences of this event could be: loss of your garage (7.1) and/or car in it (7.2), and material damage (7.3, for instance damage to car or garage, but not complete loss of either). There are a couple of possible barriers against these consequences: the fire can be detected with a smoke detector (6.1, although presumably only few of us have one in the garage), you can detect it yourself (6.2), and when the fire department (6.3) is called in they can limit the damage depending on how fast they can get to you and if water is available[2]. Interesting, of course is that these barriers are not independent from each other. Detection without follow-up is useless while the best fire department around the corner is of little help if they’re not called by someone[3].
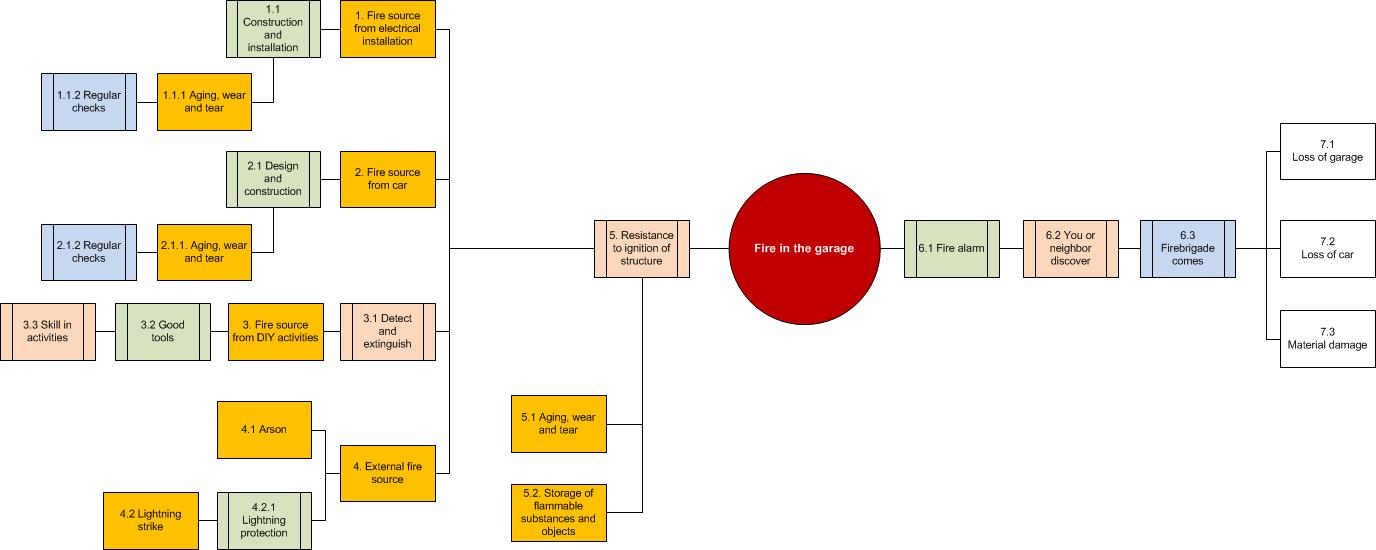
On the left side of the unwanted event we identified four main sources that could lead to a fire in the garage:
- a failure in the electrical installation (e.g. a shortcut),
- a failure in your car (e.g. an overheated brake),
- an ignition during some do-it-yourself activities that you do in your garage, or
- an external source (e.g. arson or lightning strike).
Now your garage will probably be constructed in such a way that it has some form of natural resistance against catching fire just too easily, by choice of materials. This has been placed as a barrier (5) between the various sources of ignition and the unwanted event, but this barrier can degrade, for example through aging, wear and tear (5.1), or because of the fact that you use the garage as a storage for various inflammable materials (5.2) like paint, gas and paper boxes.
You may discover that it’s pretty hard to have barriers against some hazards, like arson (4.1) in our example, and maybe we should have added ‘financial losses’ as another consequence to the right and ‘insurance’ as a barrier against this. For other hazards the barriers are clearer: if you are skilled in your DIY-activities (3.3) and you use good tools (3.2), the probability of a fire will be lower and if something happens you’re probably in the vicinity and can extinguish the spark before it develops into a real fire (3.1). Also are both your garage (including the electrical installation) and your car designed in such a way that they won’t cause fire spontaneously (1.1 and 2.1). Degrading through age and use (1.1.1 and 2.1.1) will increase the probability of failure, however, which can be countered by regular checks and maintenance (1.1.2 and 2.1.2).
This was just a really quick run through of the example. In real life you want to do a more thorough assessment on how serious the various hazards are and how good your various barriers are and maybe you will want strengthen them, e.g. by storing you paint in a steel cupboard or replacing that old switch you ‘fixed’ with duct tape last year.
Experiences so far
Concluding this article, our experiences with this ‘new’ way of doing hazard and barrier assessment so far are positive. It’s easy to use, both as a support for a structured brainstorm session and for more (qualitative) analytic purposes. The visual diagram makes it very easy to present, explain and understand and the use of various colors, icons and symbols enables elaboration in the diagram while a corresponding table provides even more detailed information about the elements. An additional advantage is that a generic hazard/barrier assessment can quickly be made specific for one location, and updated after changes to the system have been made.
One clear disadvantage is that there is no software that supports easy maintenance of the assessment. The way we had to work with a Visio/Word combination as the software basis was cost-effective at the moment, but may not be that in the long run.
The ease of use, the database structure behind it, the possibility to expand/collapse branches and other user features make for a strong argument to use the commercially available BowTie XP tool[4] - despite the drawback with regard to non-linearity/being not chronological.
Another challenge may be the thing with dependencies. Our aim is to gather further experience in the course of 2013 by applying this kind of hazard/barrier assessment to other types of unwanted events (e.g. occupational safety) and refine the method through discussion with more safety professionals inside and outside our organization.
---+---
We hope we got the example across clearly enough and appreciate feedback and discussion! In the next article we will discuss some possibilities for strengthening the barrier management.
[1] While the Wikipedia article is informative it has to be remarked that there is no proven causation, only an assumed cause and that even is unlikely. The National Accident Board has published a detailed report in Norwegian with an English summary.
[2] We realize that we are far from complete here. Other forms of follow-up could be that you try to extinguish the fire yourself or that you try to get your car out of the garage. To name but a few more.
[3] So, one might consider combining these elements the same way as done for element 3.1.
[4] Or a similar tool we don’t know yet about…


